Analysis and visualization
Integrates data from all TeamCloud modules (including external systems) according to location / customer / month / department / focus group / etc.
Live data
Analyze real-time data without delay
Identify deficits
Find weaknesses in your training structure: Why are performance targets not met? What must be done to meet them?
Event analysis
Success rate / duration / frequency / patterns / etc.
Error and cause analysis
Identify the most frequent mistakes during training, including cause analysis: Find ways to reduce errors.
Employee analysis
Analyze missing requirements / performance targets / satisfaction / reasons for exiting the company / etc.
Customizable KPIs
Your company goals can be represented precisely.
Healthy competition
Foster healthy competition between your teams. How are performance targets developing over time? How are they developing for specific locations / departments?
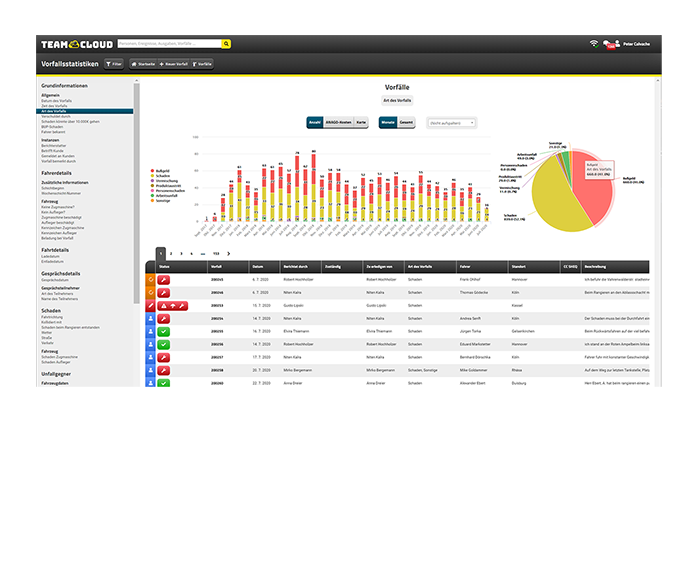
Powerful incident statistics
Detailed monthly breakdown, correlation analysis, and trend analysis of all quantifiable information of the incident documentation process.
Maps integration
Visualize the various distributions geographically on a map.
Heat map
Analyze distributions of vehicle damage / equipment damage / personal injuries / etc. via heat map visualizations.
Powerful filtering functionality
Full integration of the data in TeamCloud Base as well as all incident information.


